List of Dashboards
K8s
A modern set of Grafana dashboards for Kubernetes.
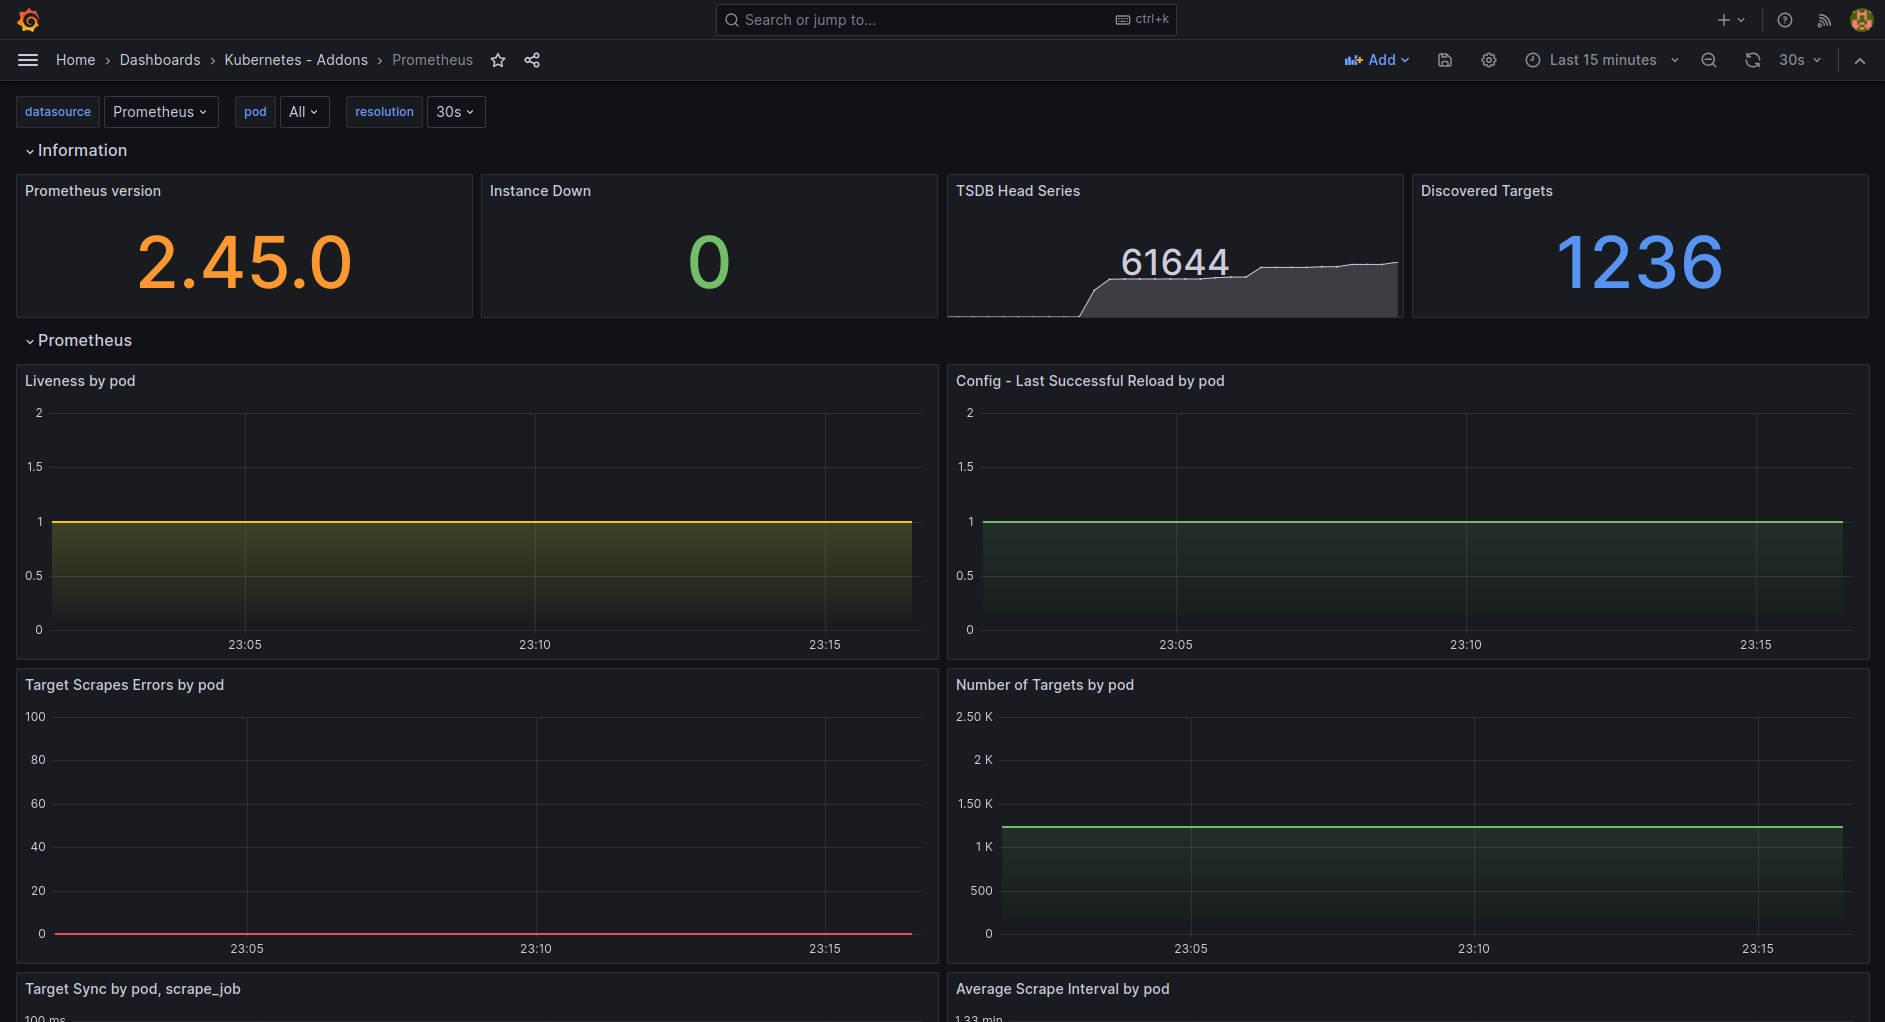
Dashboard for Prometheus
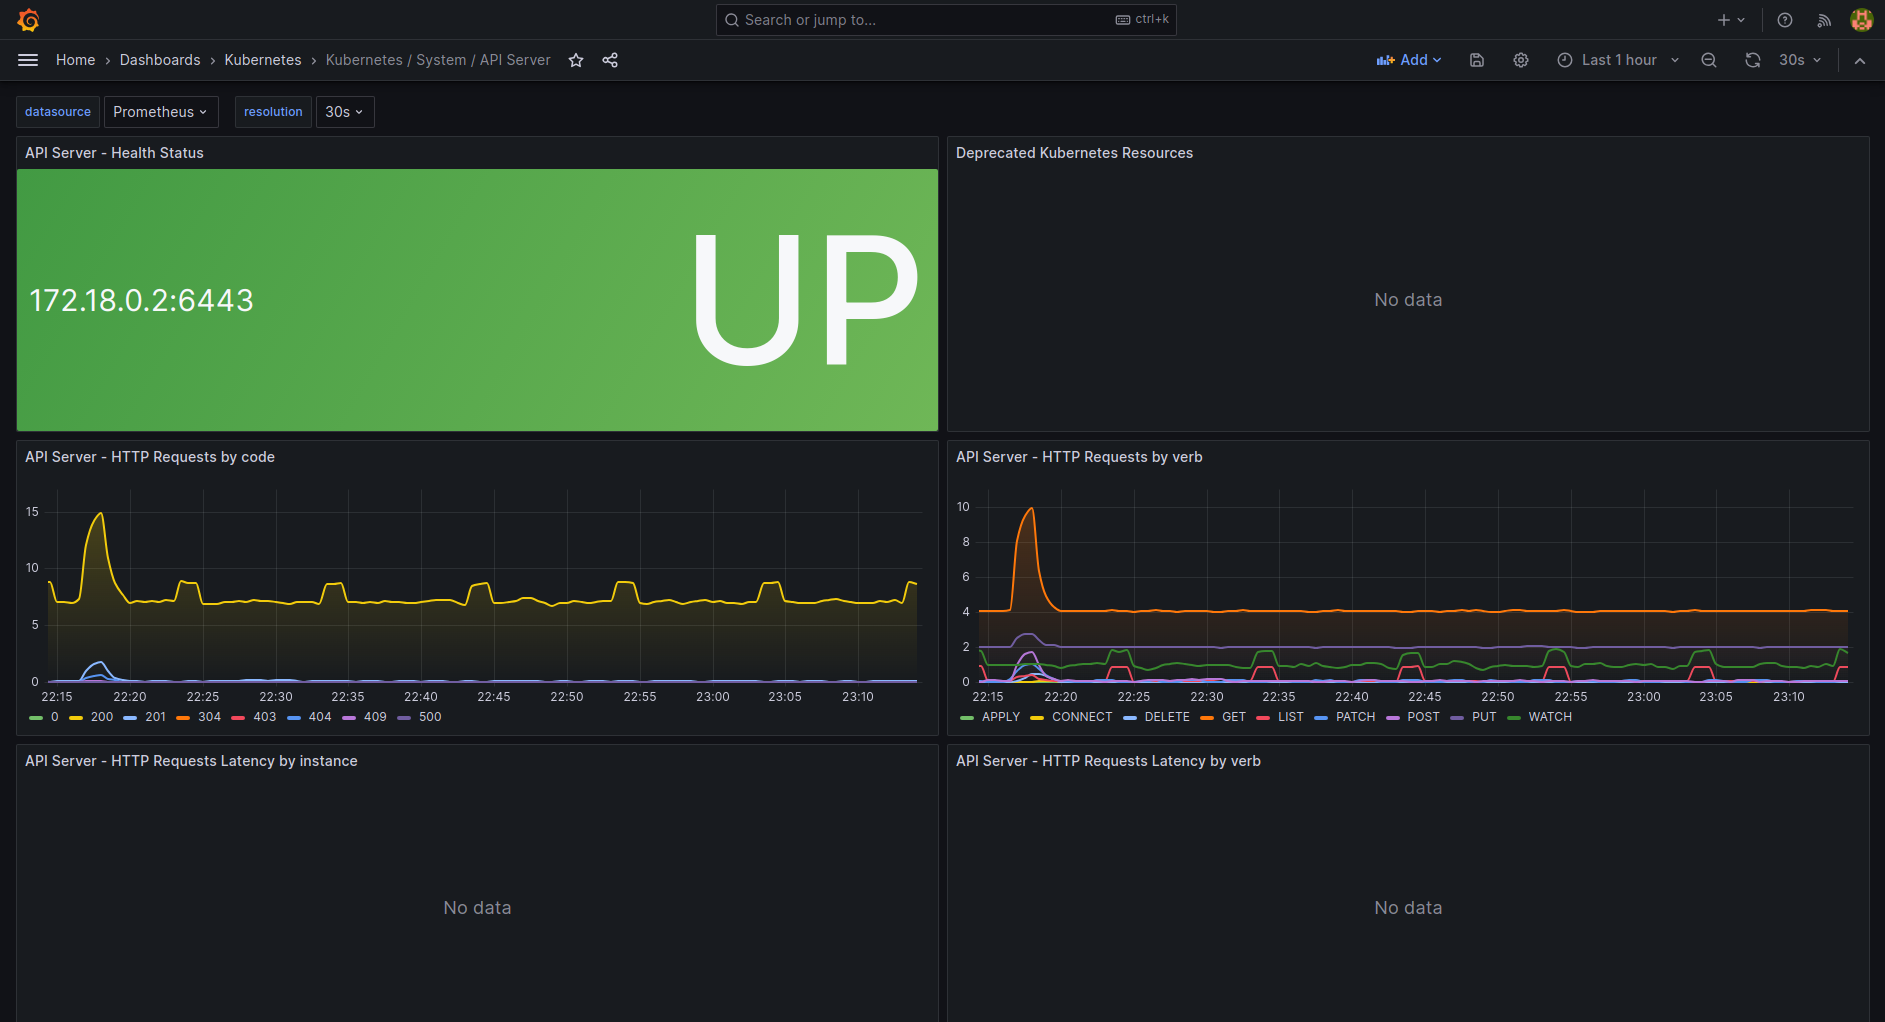
Dashboard for the API Server Kubernetes component
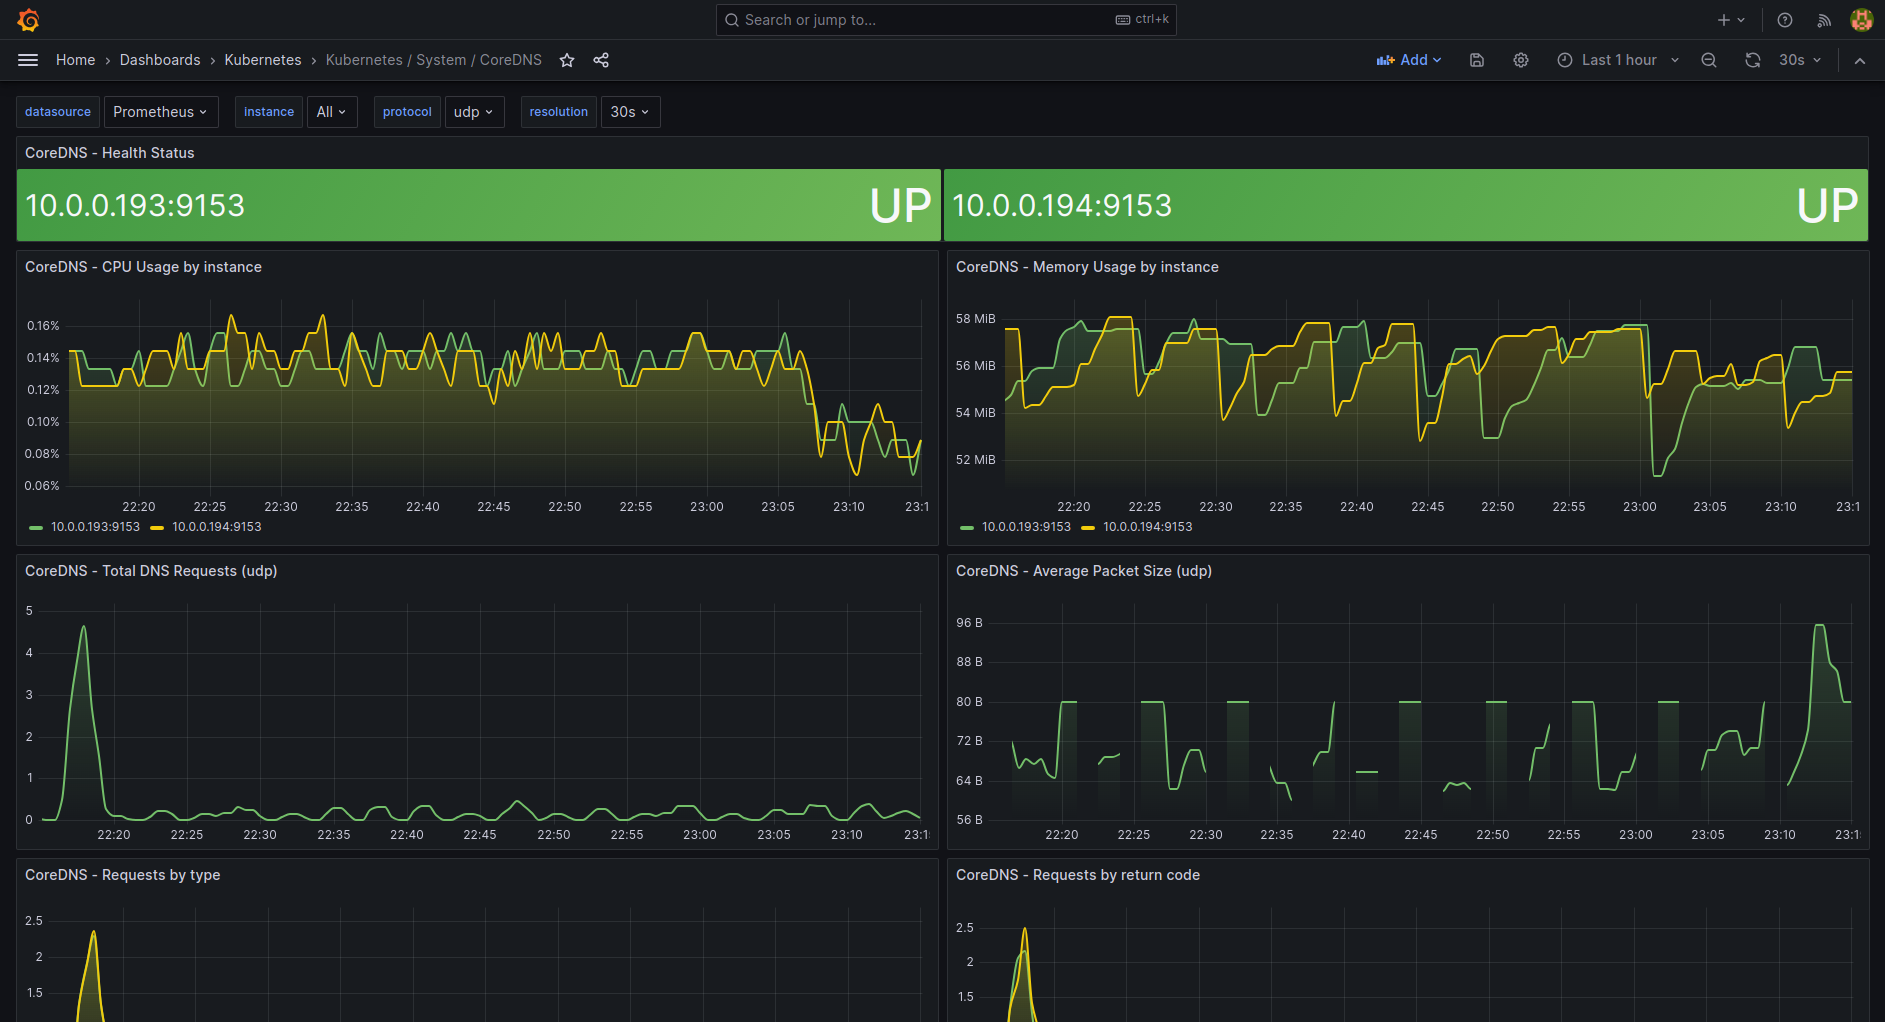
Show information on the CoreDNS Kubernetes component
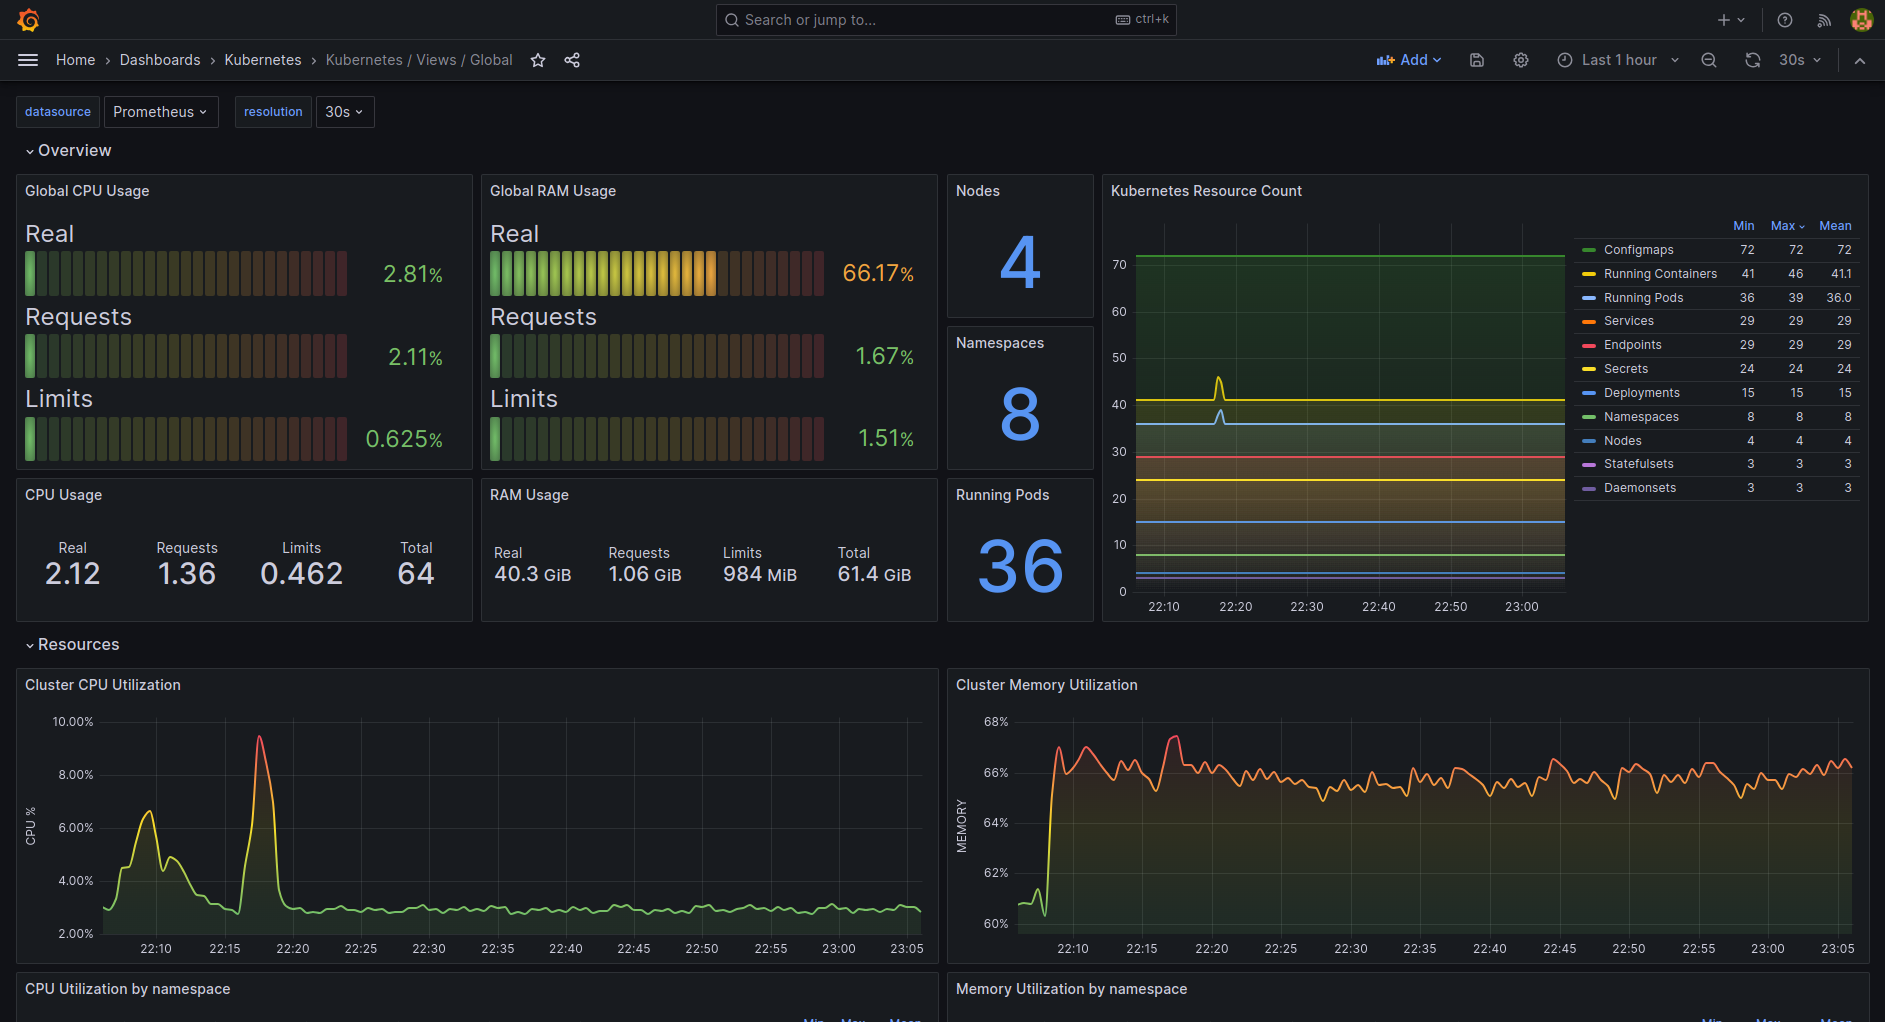
Global level view dashboard for Kubernetes
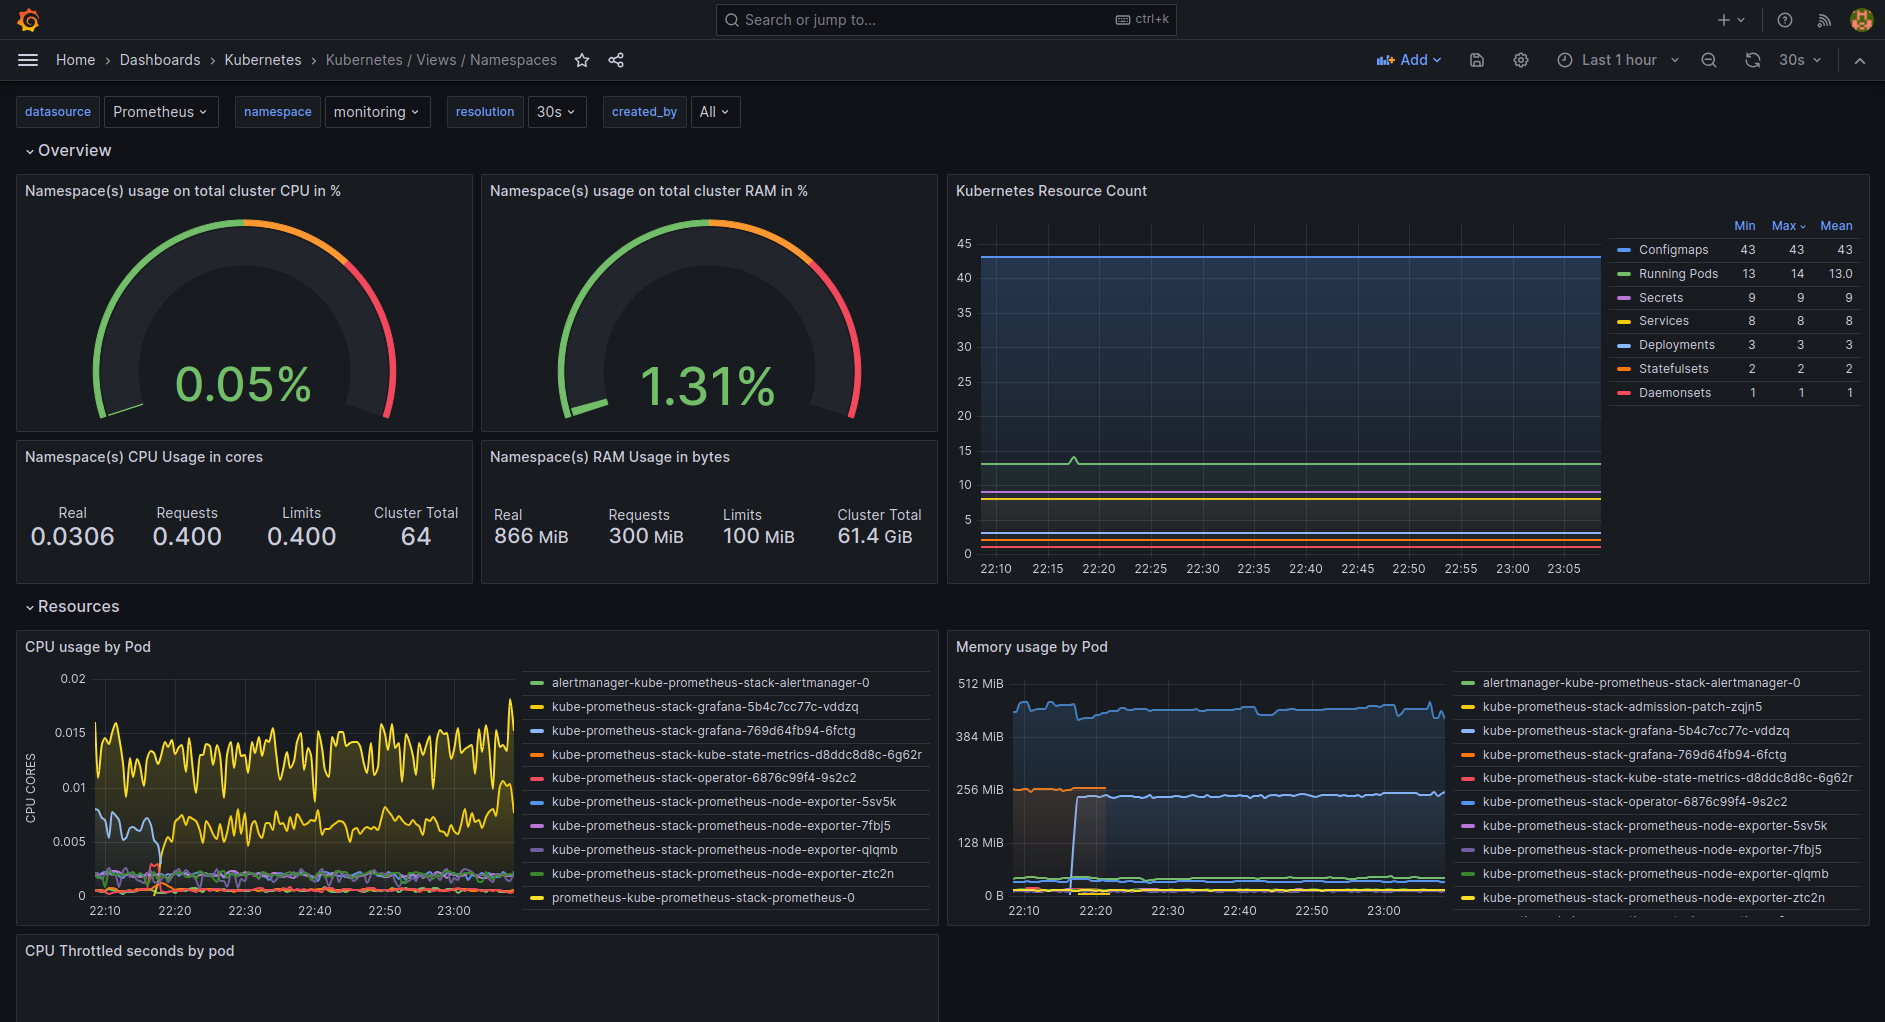
Namespaces level view dashboard for Kubernetes
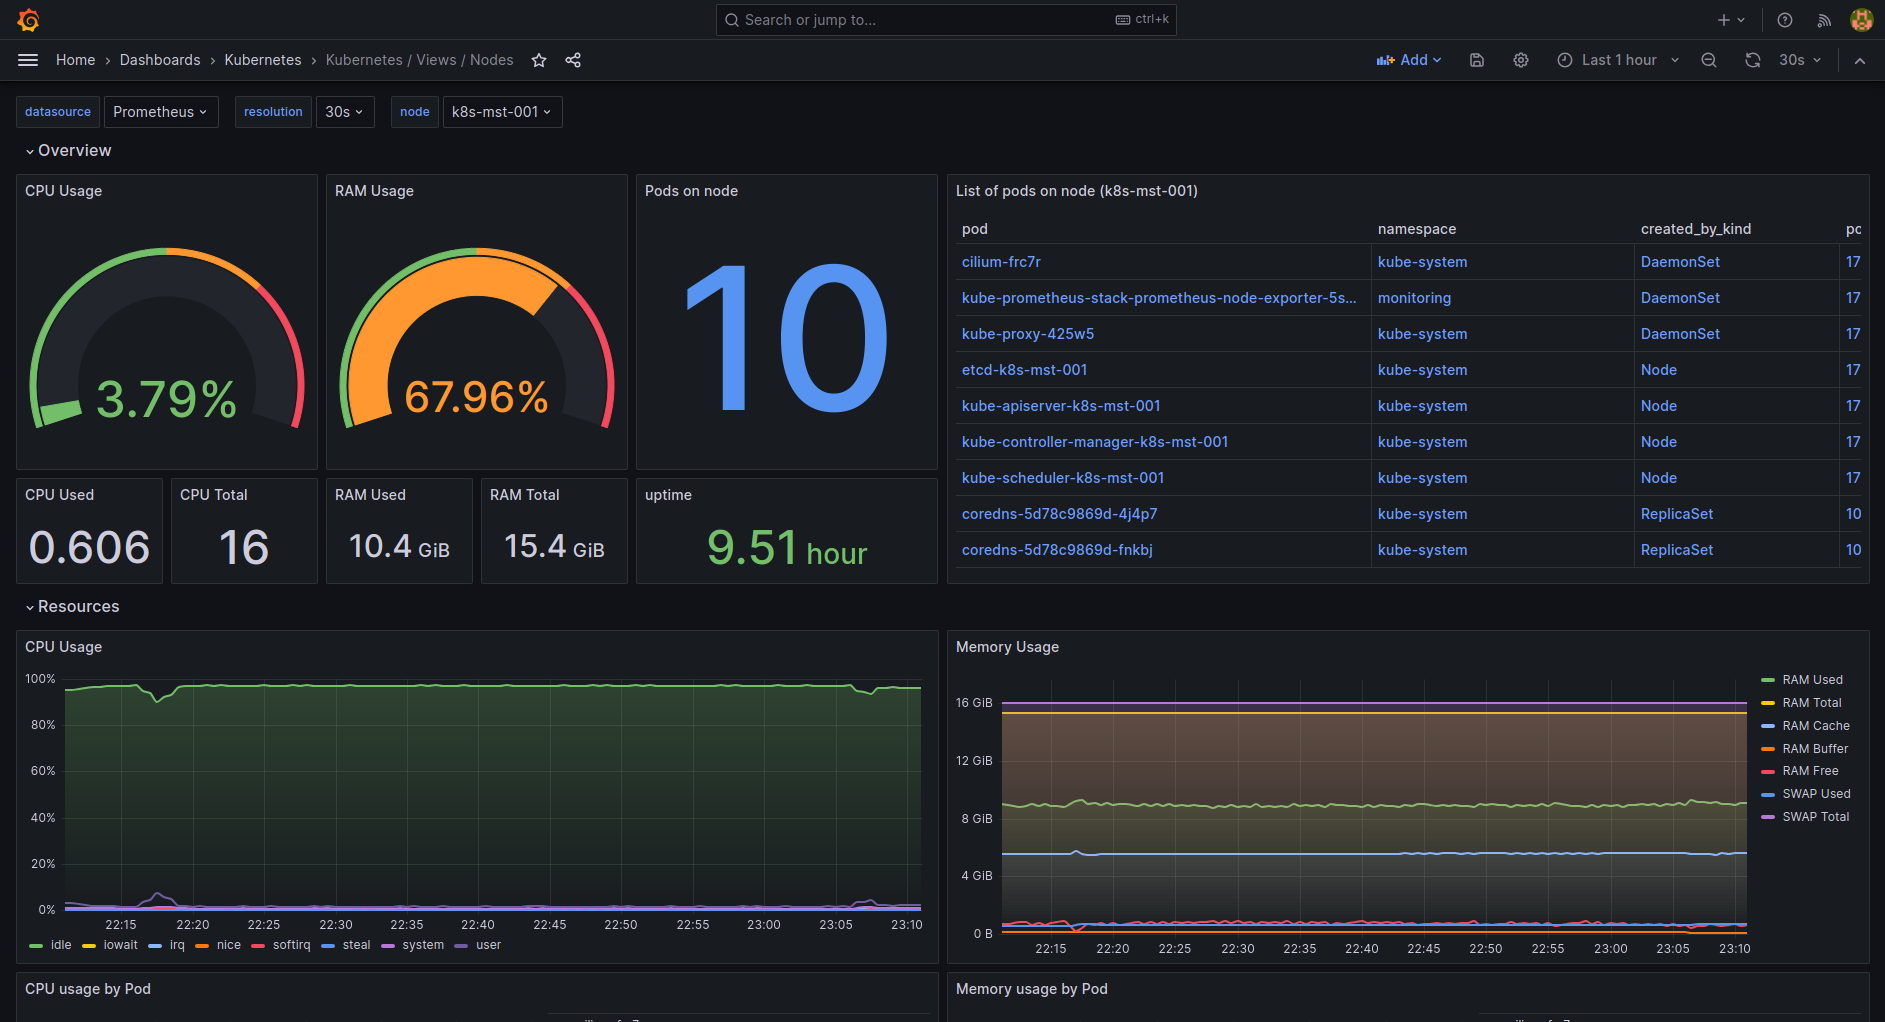
Nodes level view dashboard for Kubernetes
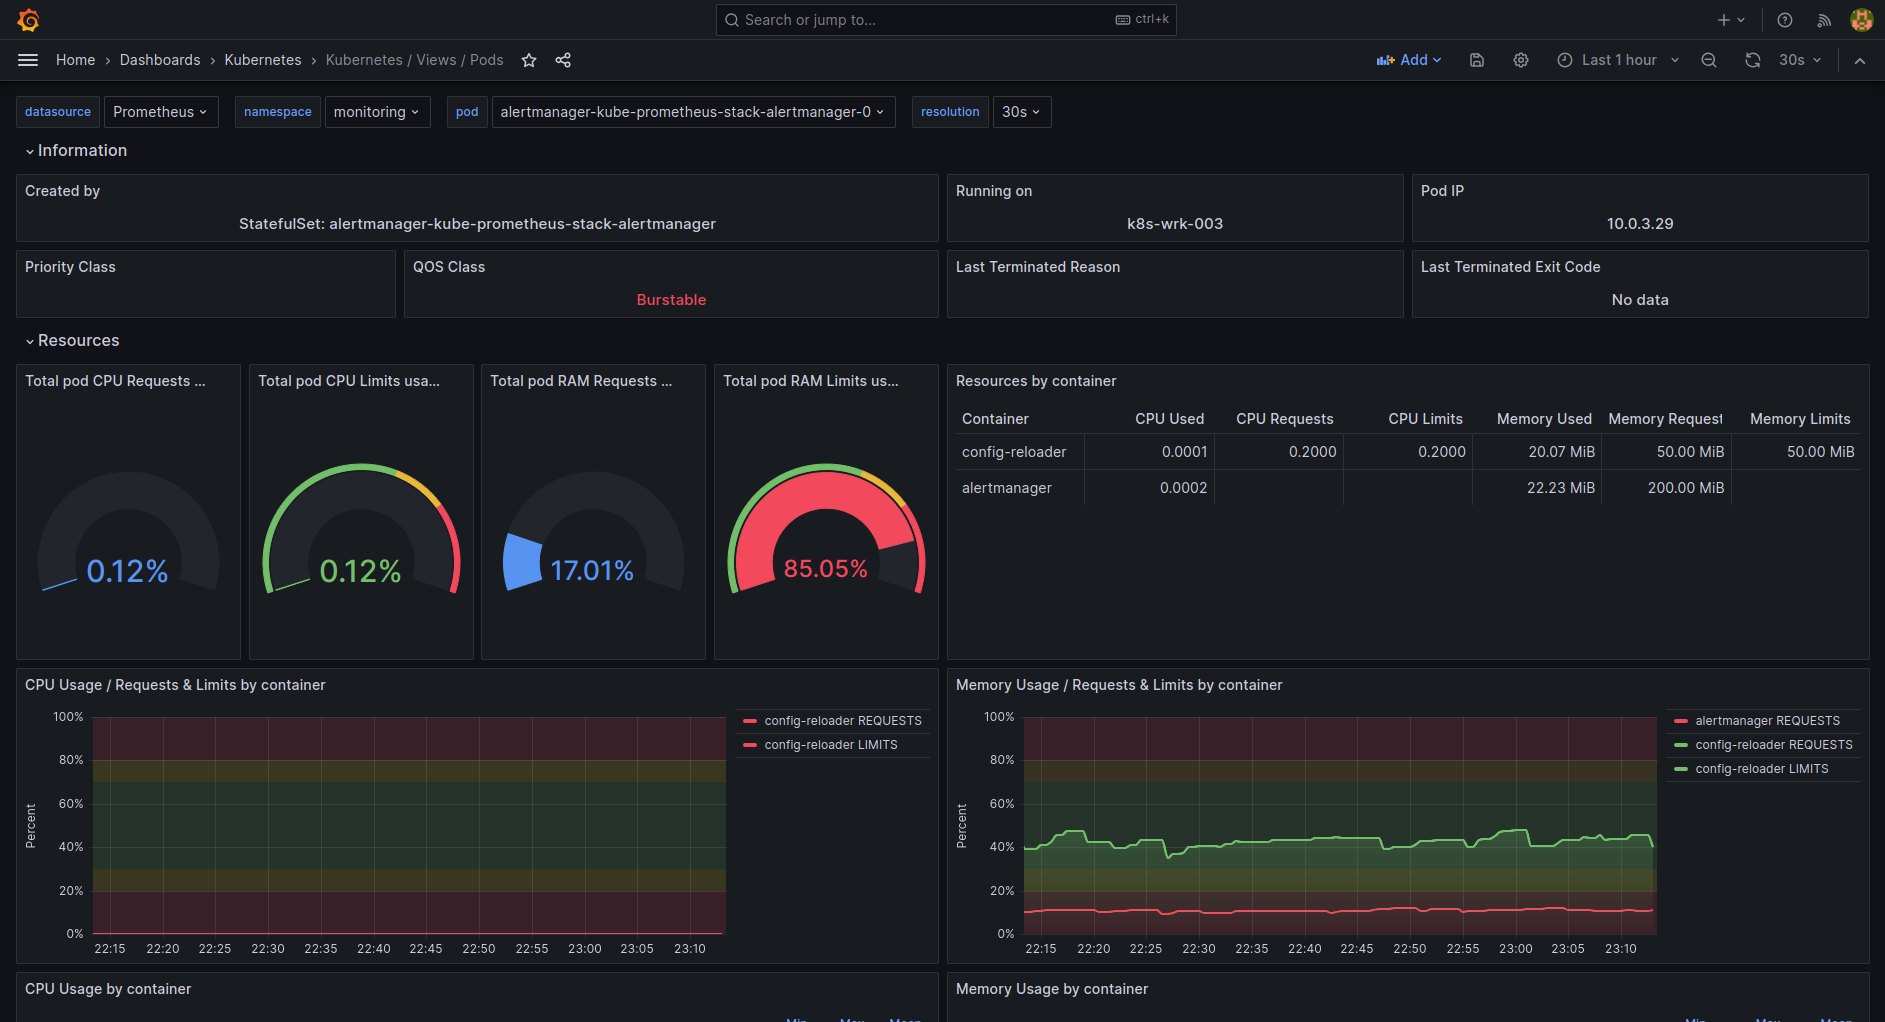
Pods level view dashboard for Kubernetes
USE
The Utilization Saturation and Errors (USE) Method dashboard that can be used to quickly identify resource bottlenecks or errors.
Security
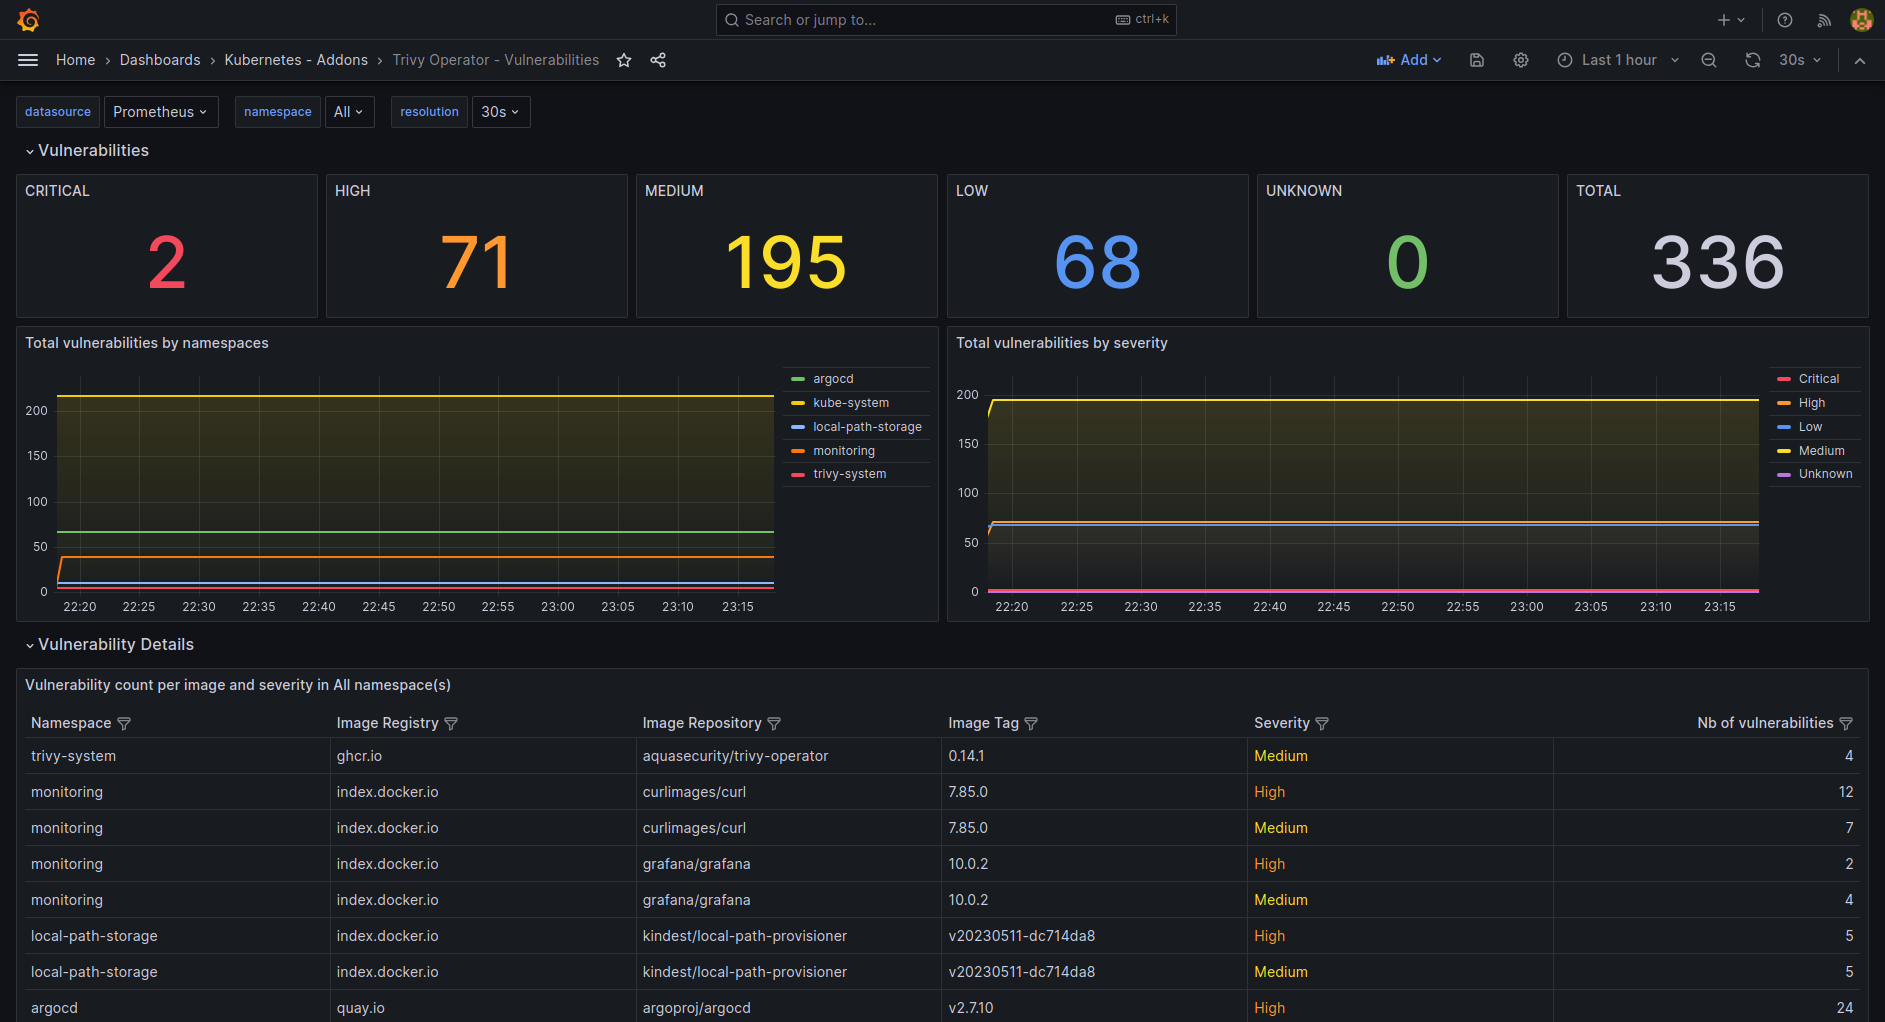
Trivy
Dashboard for the Aqua Security Trivy Operator
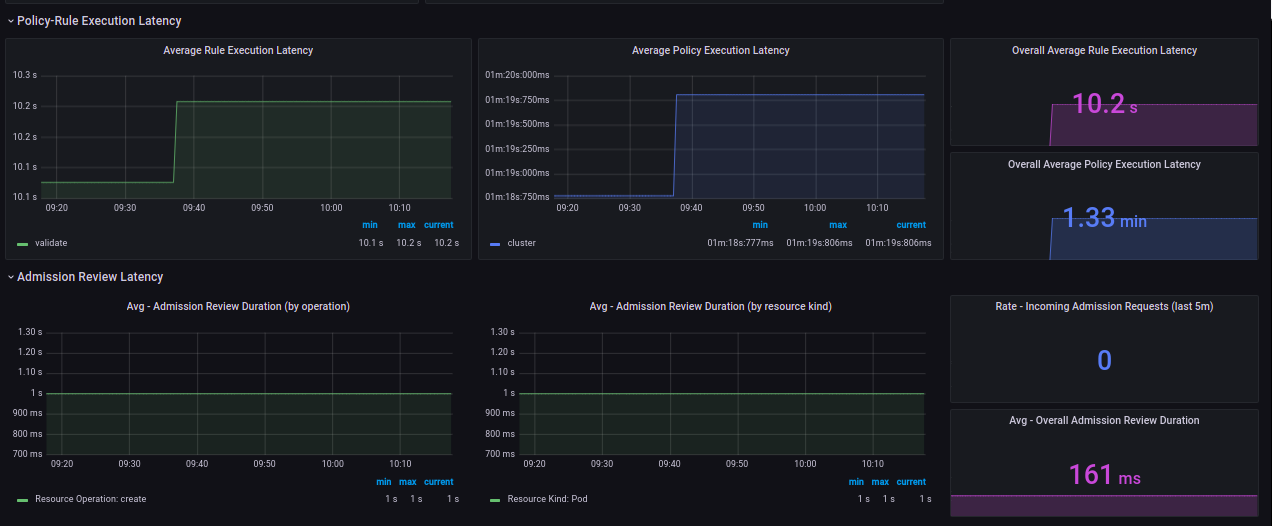
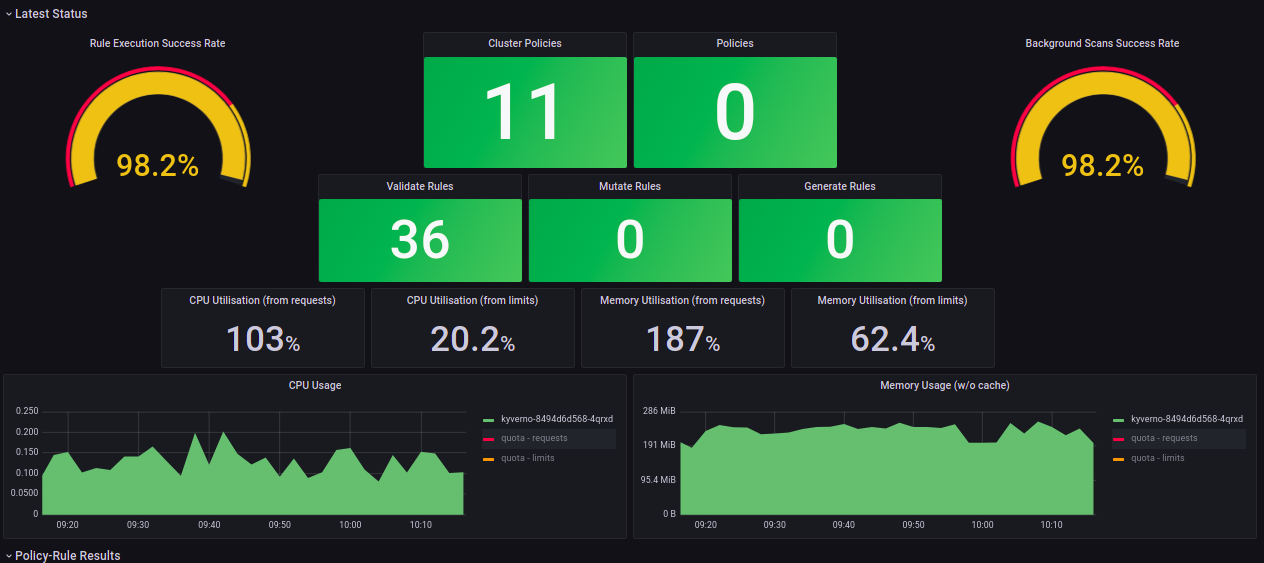
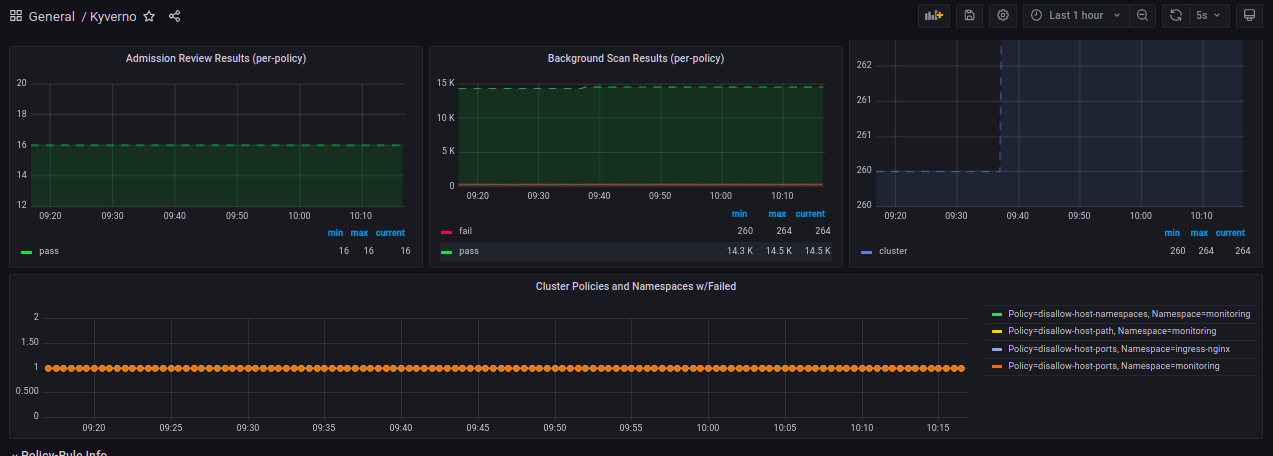
Kyverno
Cost
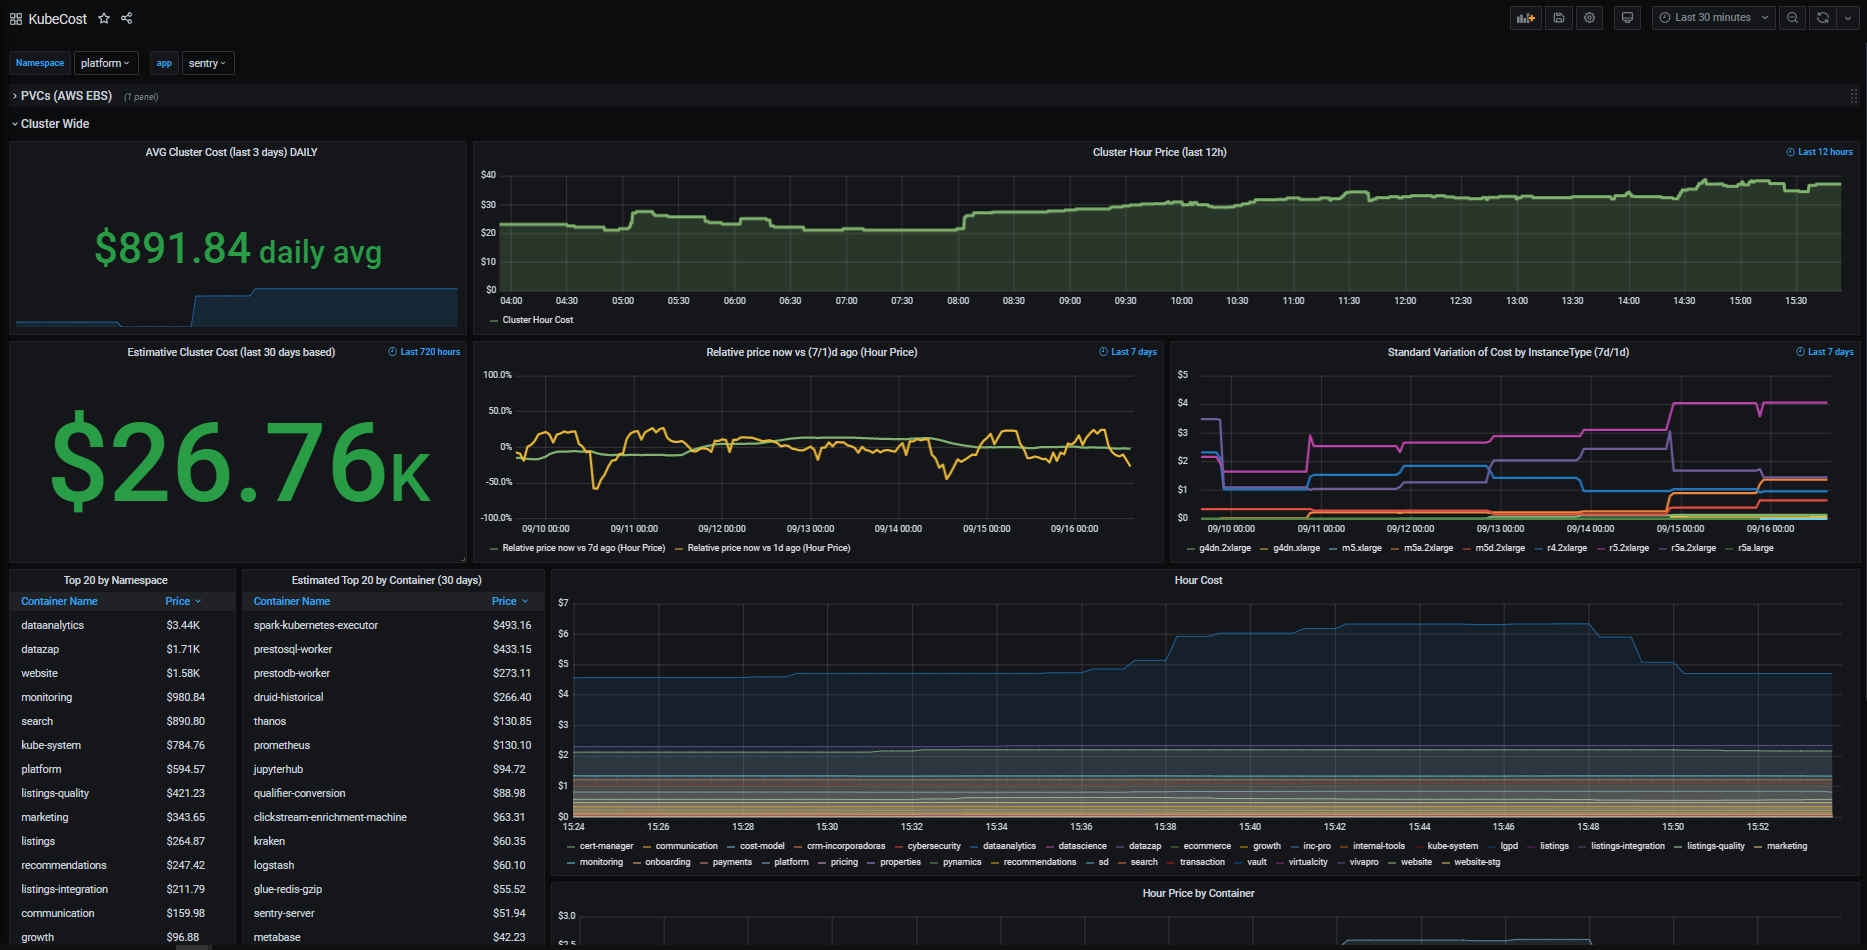
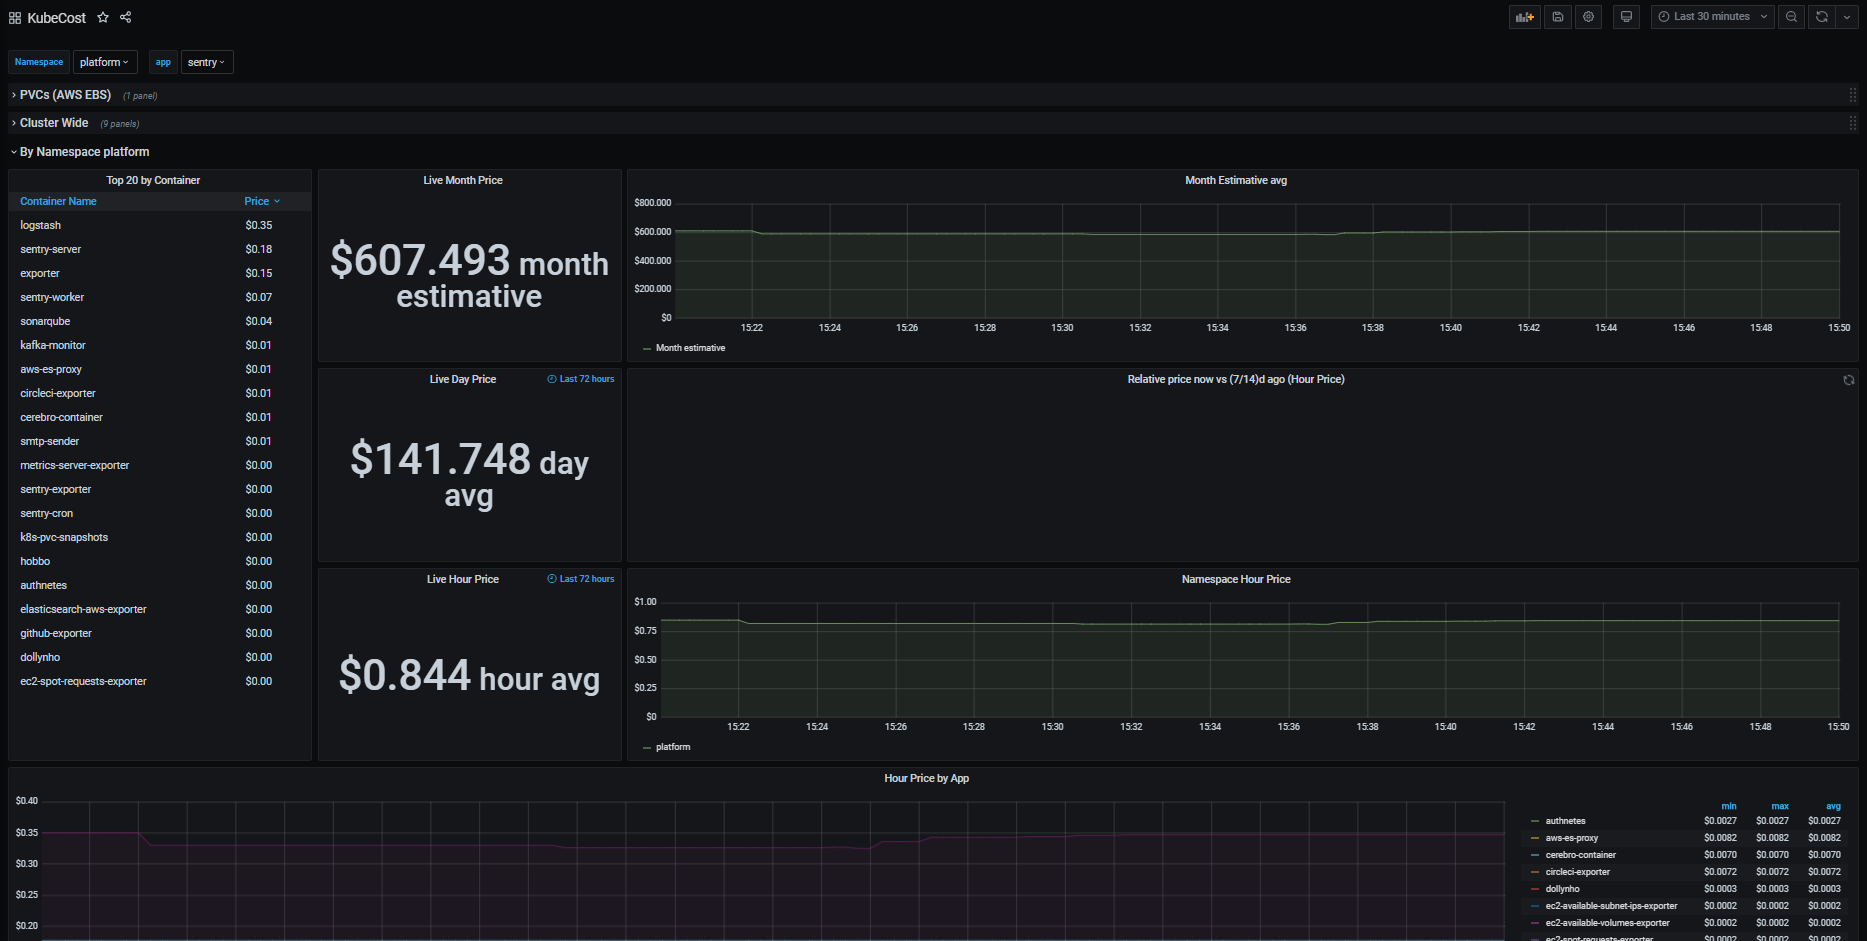
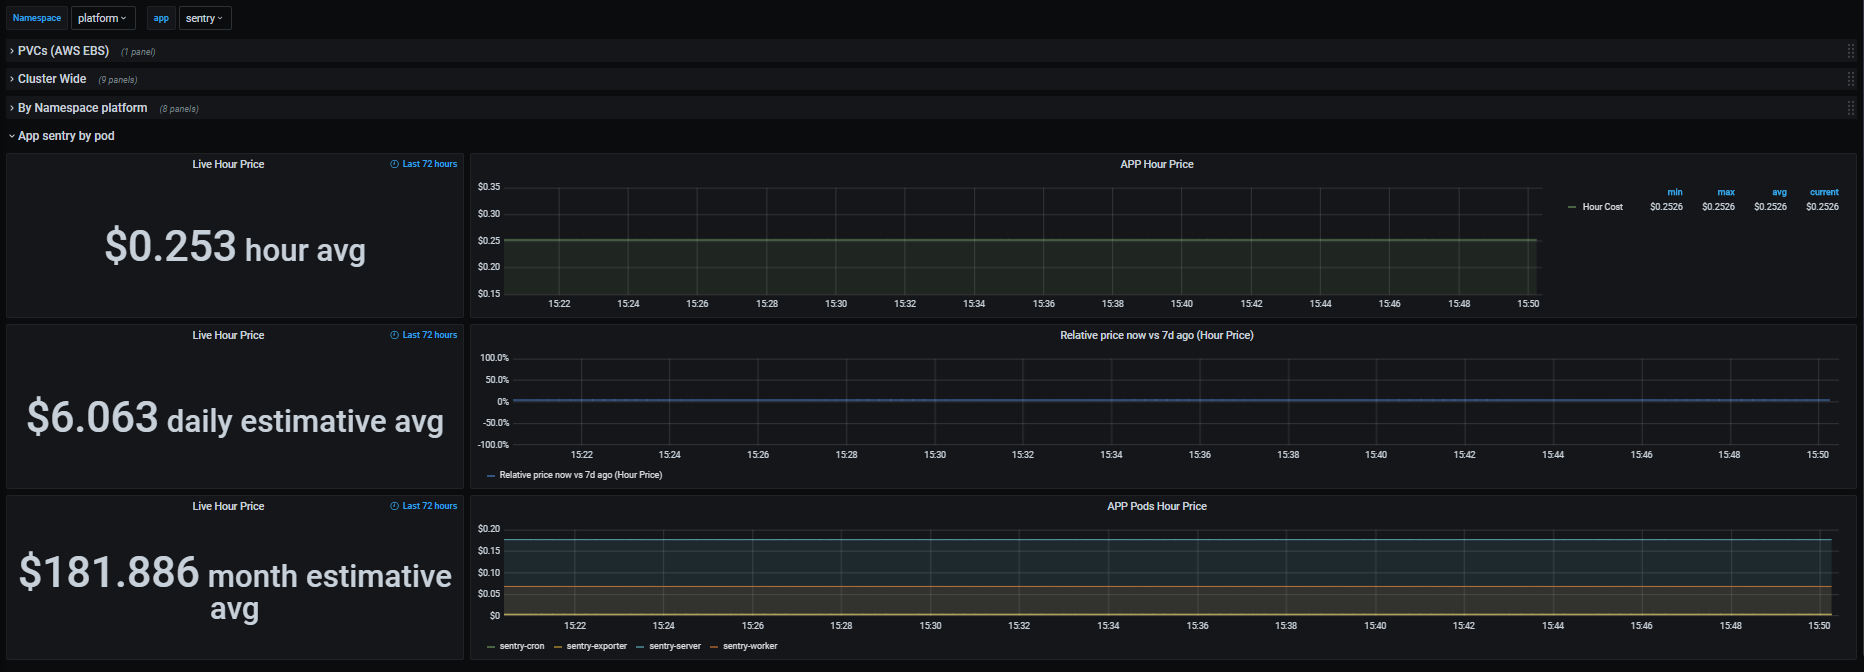
KubeCost cluster metrics
Dashboard integrated with KubeCost providing a view on findings and insights. This dashboard gives you Kubernetes cluster costs:
- Cluster Wide (Live and Estimative)
- Relative price of spot instances
- Namespace (Live and Estimative)
- Price variation between days and weeks
- APP (Live and average)
- Price comparison with 7 days ago
- PVC Costs
Node.js
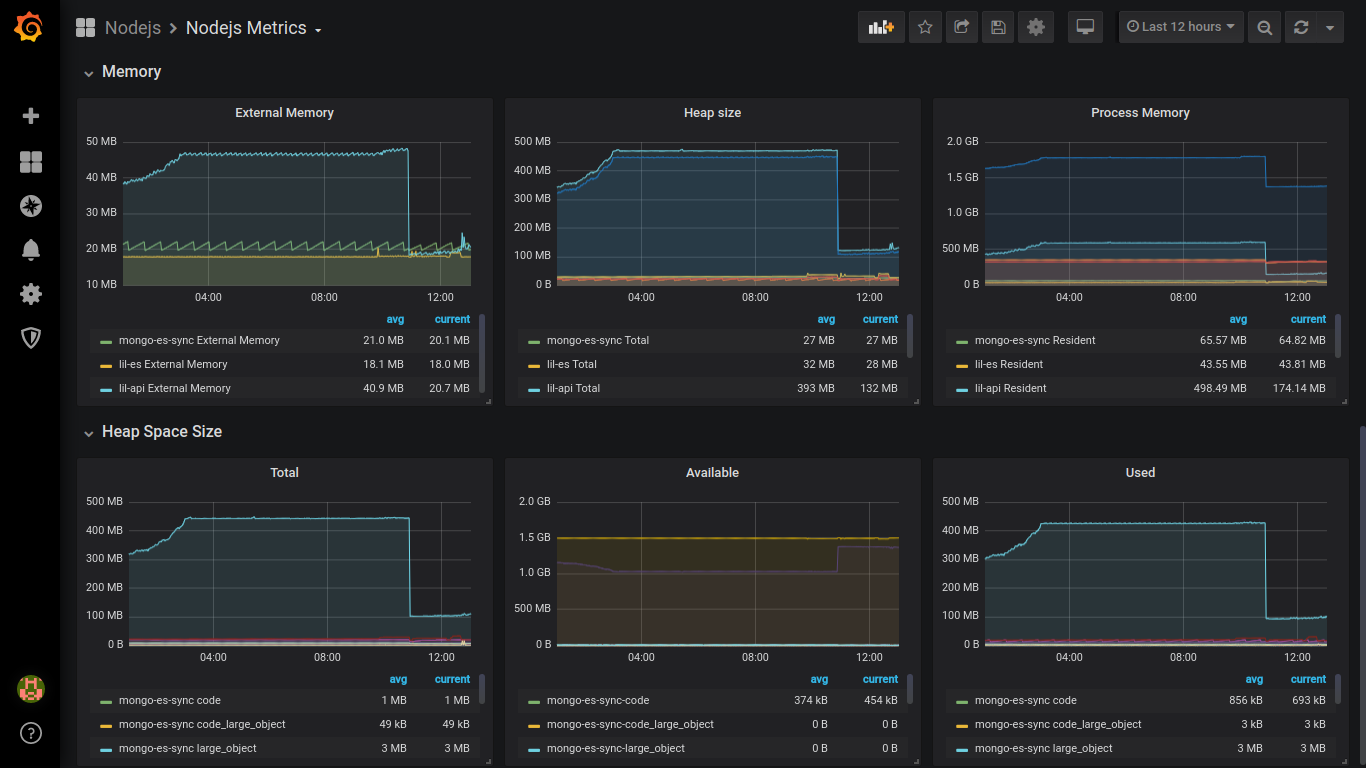
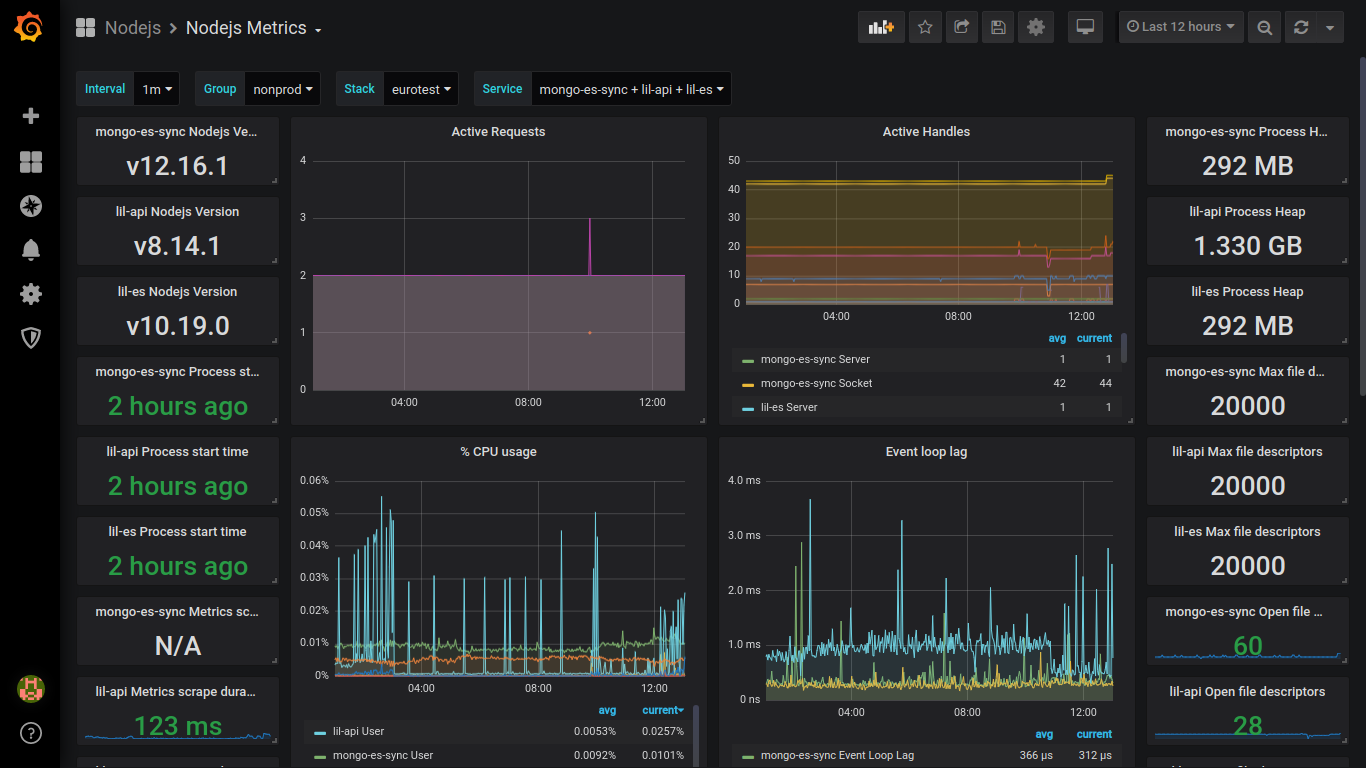
Node.js metrics
Based on this template
This dashboard works with the metrics exported by the prom-client package for node.js.
CG DevX Log management is pre-configured to automatically collect metrics exported by node.js application.
